Sign up NowSign up for free. No Credit Card Details Required.
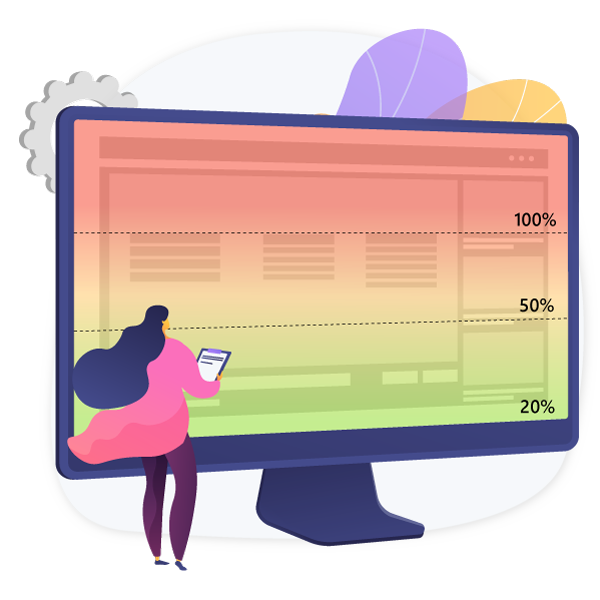
Discover how visitors interact with your website in real-time with onWork.ai’s heatmaps feature. Our powerful AI heatmap tool helps you visualize user behavior heatmaps like never before, turning clicks, scrolls, and movements into clear insights that drive engagement and conversions.
With onWork.ai’s heatmap analytics, you don’t just track numbers; you see exactly how users behave across your site. This visibility helps you uncover pain points, optimize content, and deliver a seamless digital experience.
User behavior heatmaps reveal where visitors get stuck or confused, helping you improve usability and reduce bounce rates
Understand engagement with text, images, and videos to refine your content strategy for higher interaction.
Use responsive heatmap analytics to track how mobile visitors interact and ensure a smooth mobile experience.
Validate test results with visual data. Compare click heatmaps between variations to confirm what truly works.
onWork.ai’s AI heatmap generation goes beyond traditional tools by providing actionable insights that guide your optimization strategy. Our heatmap analytics suite includes three types of visual maps:
Ready to see your user journey like never before? Start optimizing with onWork.ai’s heatmap analytics today.
AI-powered Heatmaps aren’t just about visualizing clicks and scrolls - they’re about uncovering the why behind user behavior. By turning raw data into clear visual patterns, heatmaps help businesses of all sizes make smarter, faster decisions. From improving user experience to boosting conversions, they give you the clarity needed to design websites that truly engage.
Identify which elements drive action and optimize them to maximize sales, sign-ups, or leads.
Eliminate friction points by understanding where users hesitate or drop off.
Make smarter, data-driven design changes without relying solely on guesswork or lengthy research.
Ensure both desktop and mobile visitors have a seamless, engaging journey.
Turn visitor interactions into actionable insights that drive continuous improvement.
Adding {{itemName}} to cart
Added {{itemName}} to cart